Tableau Analysis
Commentary
In this section, calculations were performed based on the metrics specified above using the relevant databases, and the results obtined were interpreted and visualized. All the work was done in Tableau Public, and the and you can access the prepared dashboard here.
Scripts
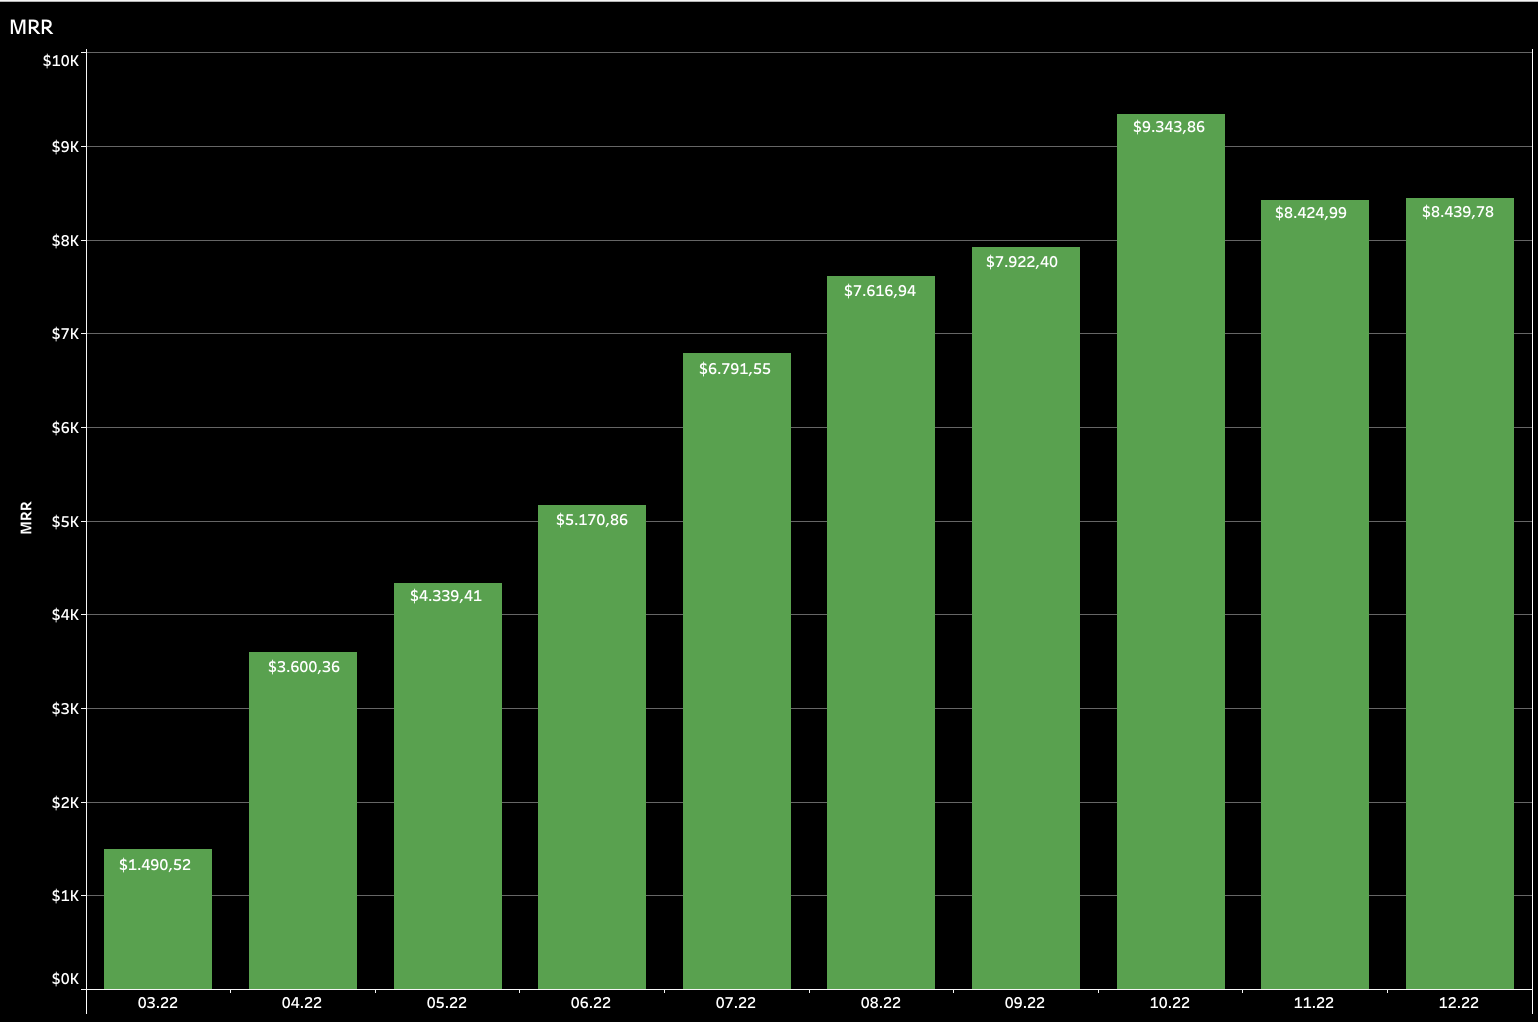
Script 1. Calculating MRR
//MRR
sum([Total Revenue])
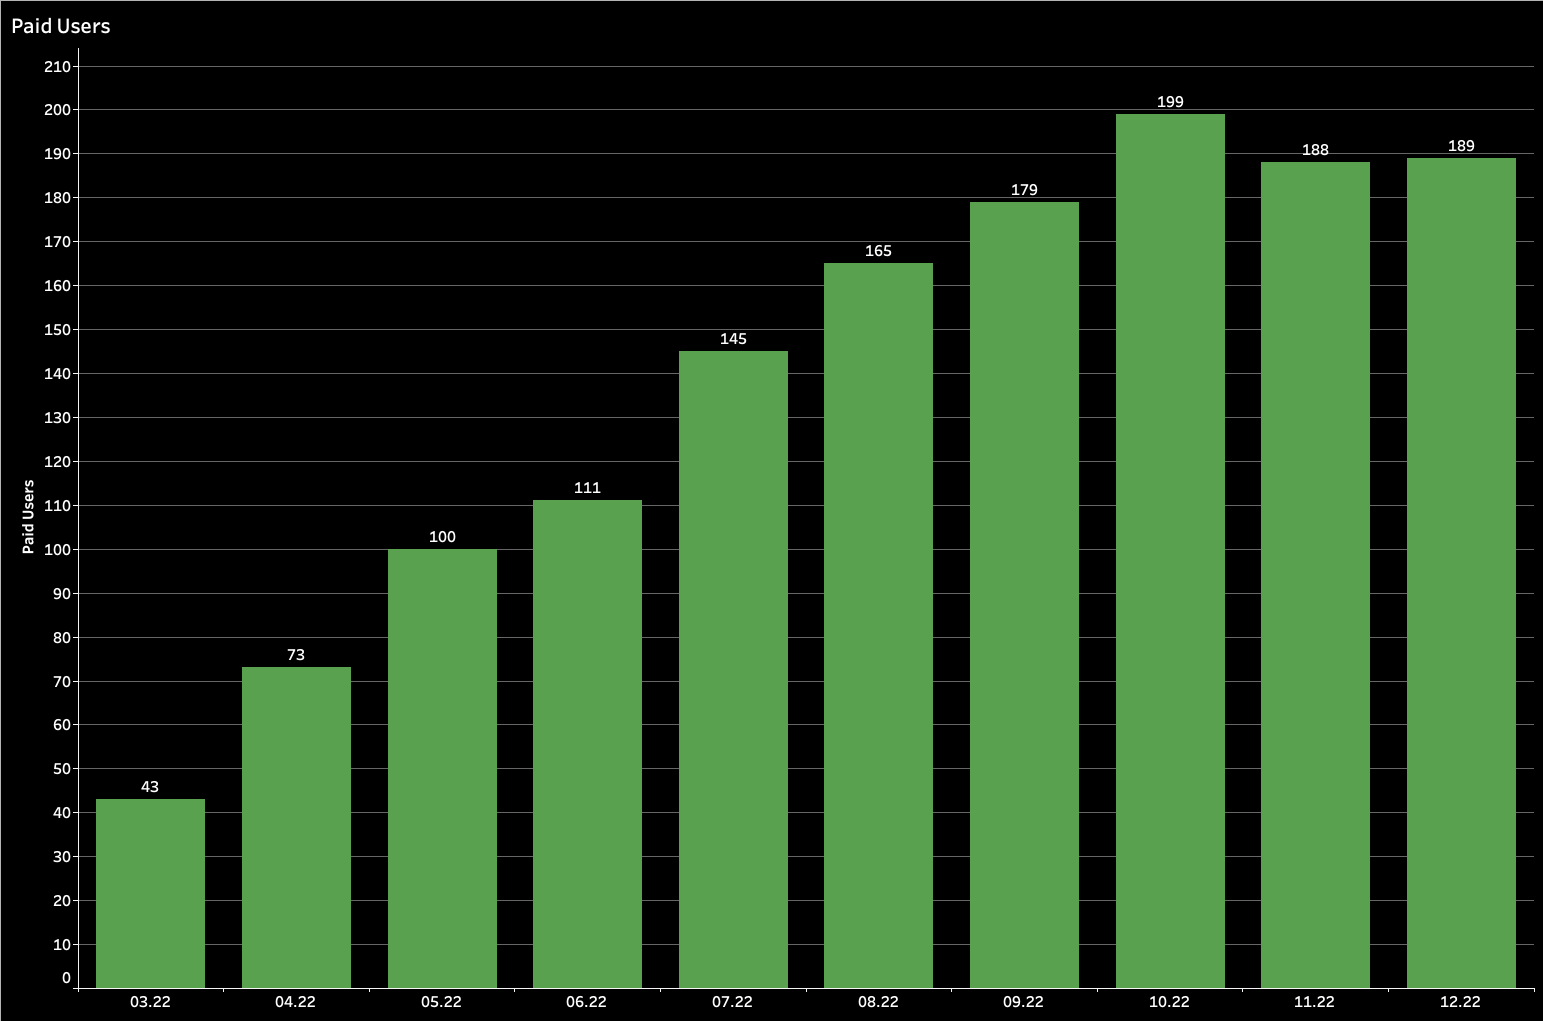
Script 2. Calculating Paid Users
//Paid Users Count
SUM(
    IF [Status] = 'new' OR [Status] = 'active' OR [Status] = 'back'
    THEN
        1
    ELSE
        0
    END
)
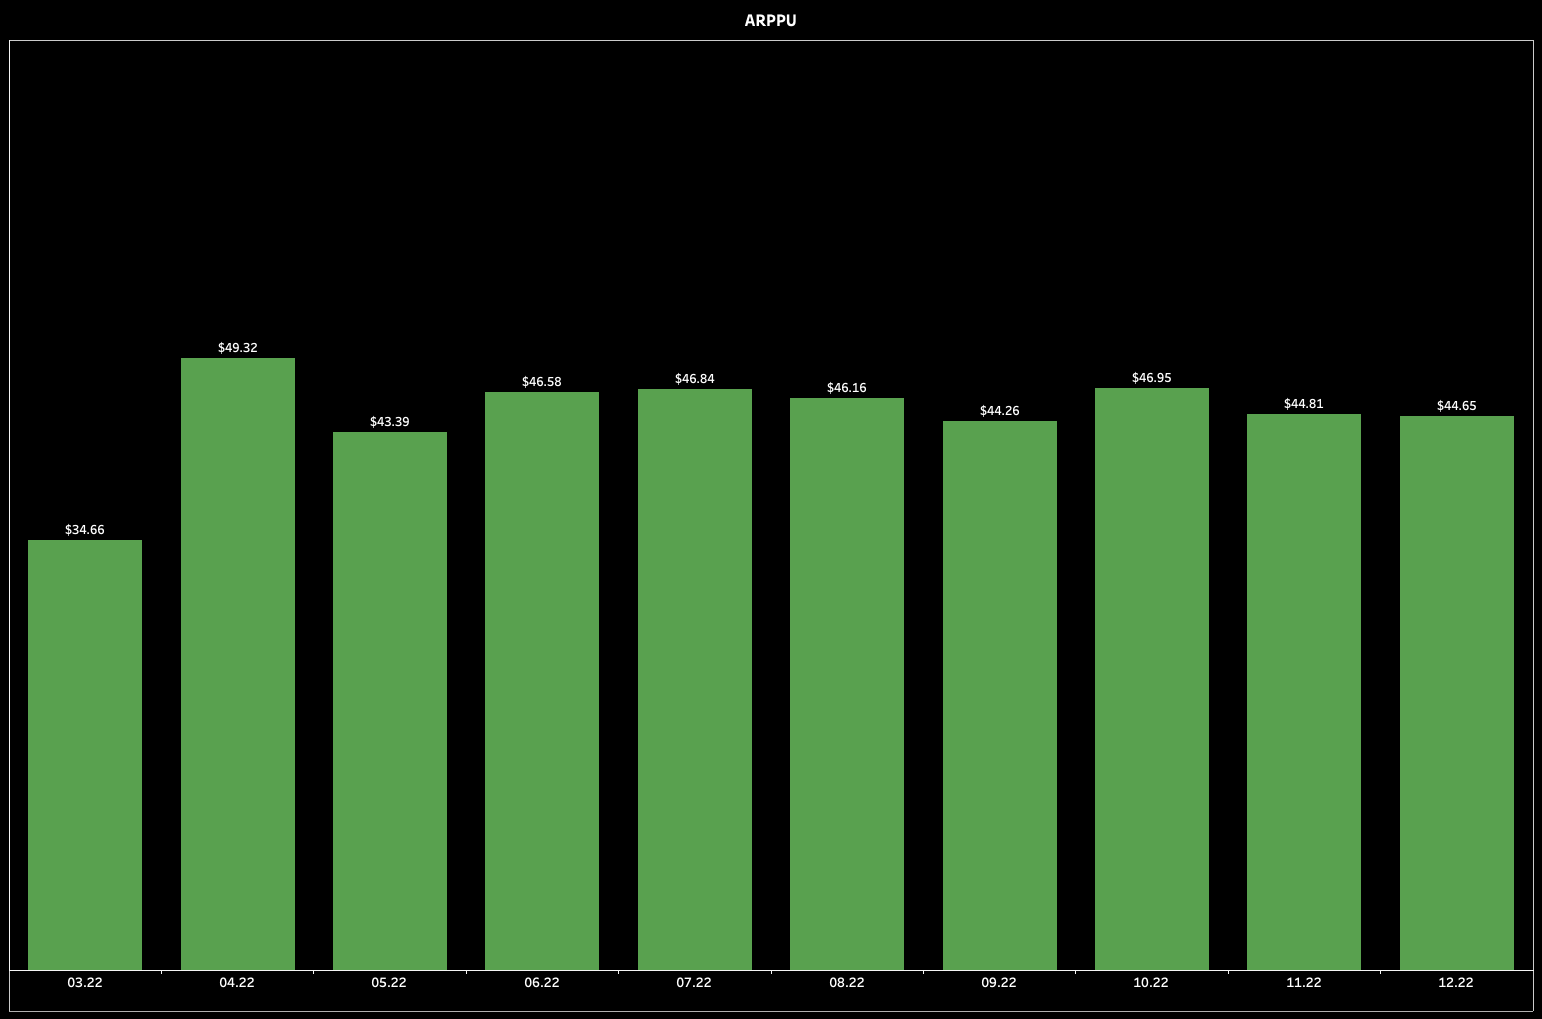
Script 3. Calculating Average Revenue Per Paid User (ARPPU)
//ARPPU
[MRR] / [Paid Users]
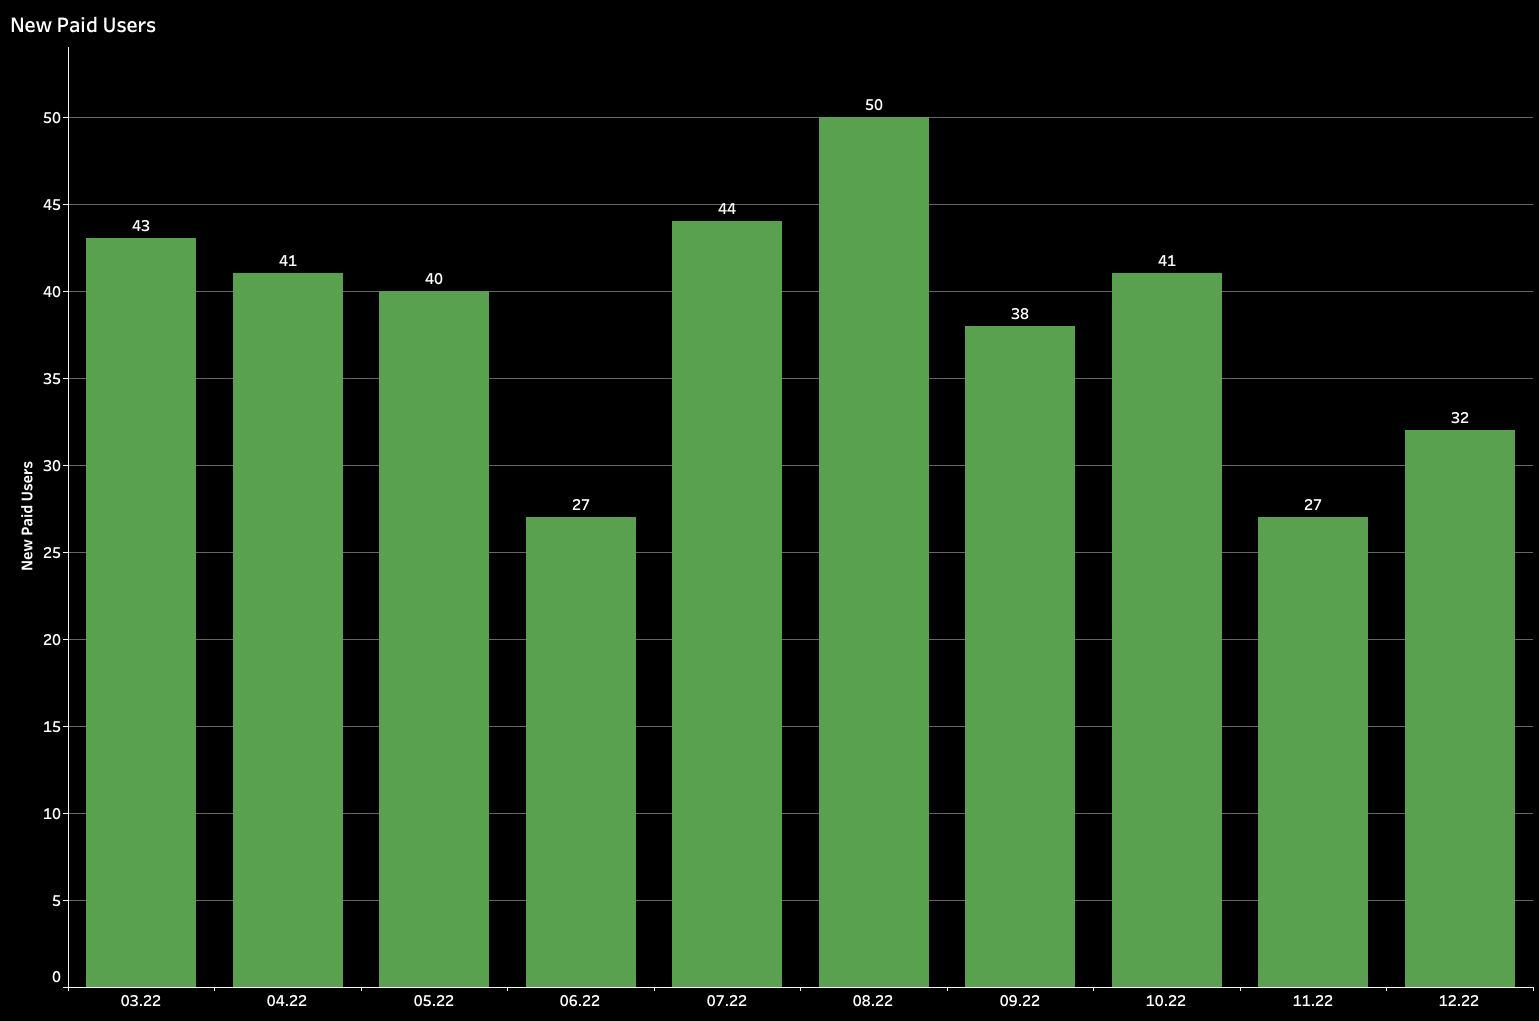
Script 4. Calculating New Paid Users
//New Paid Users
SUM(
    IF [Status] = 'new'
    THEN
        1
    ELSE
        0
    END
)
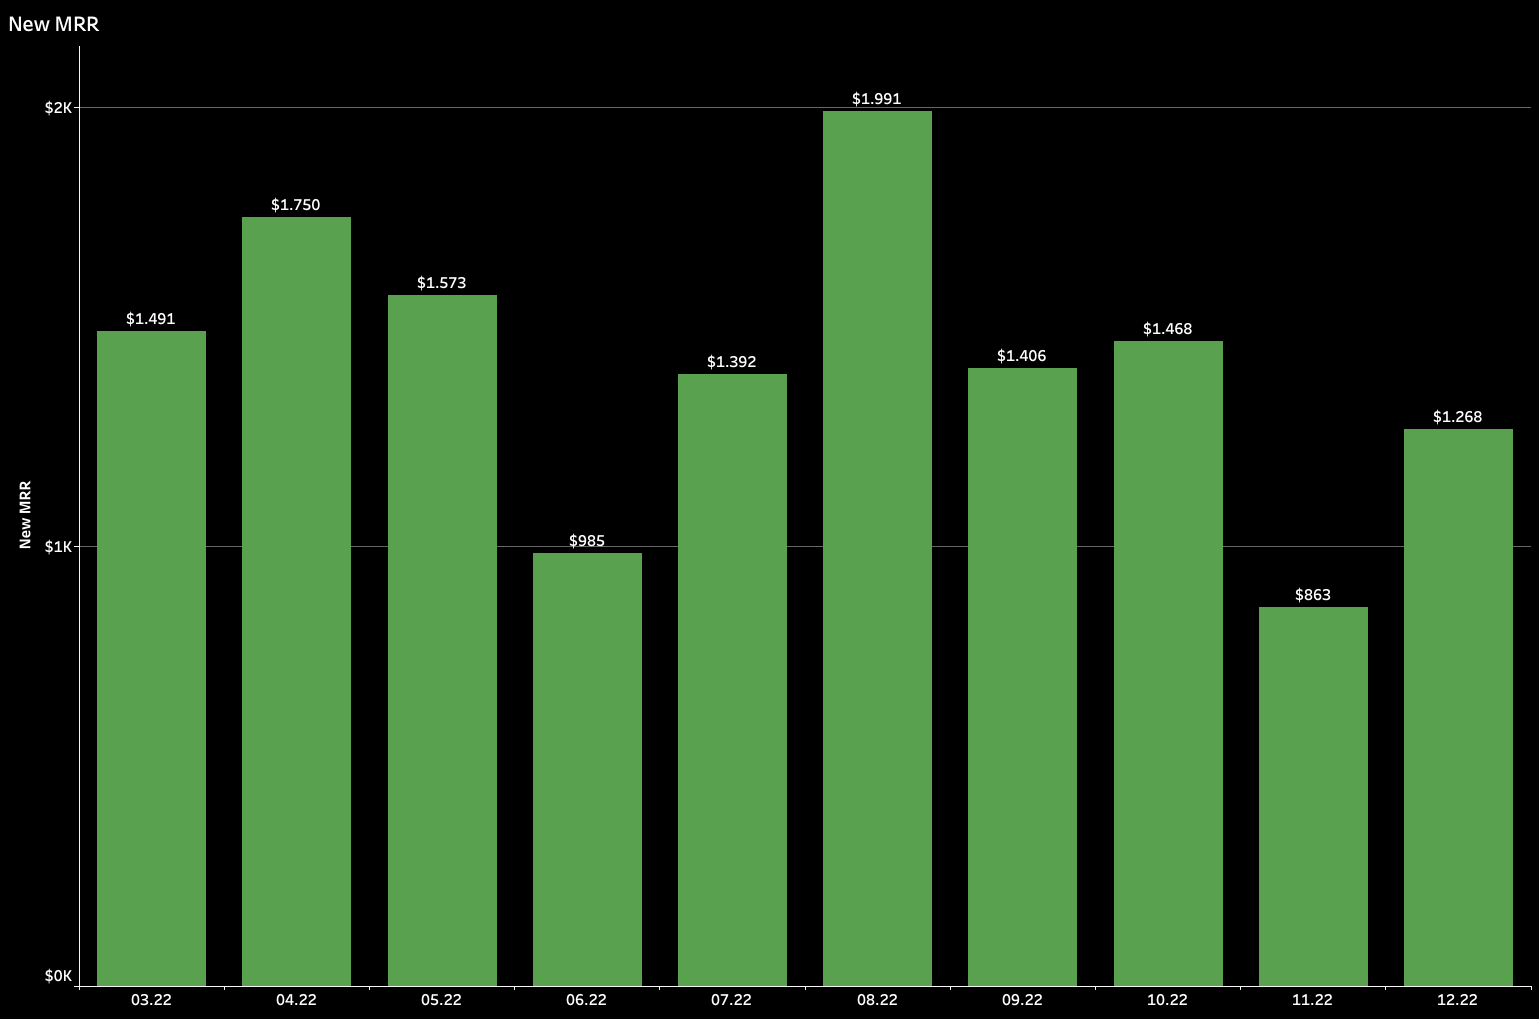
Script 5. Calculating New MRR
//New MRR
SUM(
    IF [Status] = 'new'
    THEN
        [Total Revenue]
    ELSE
        0
    END
)
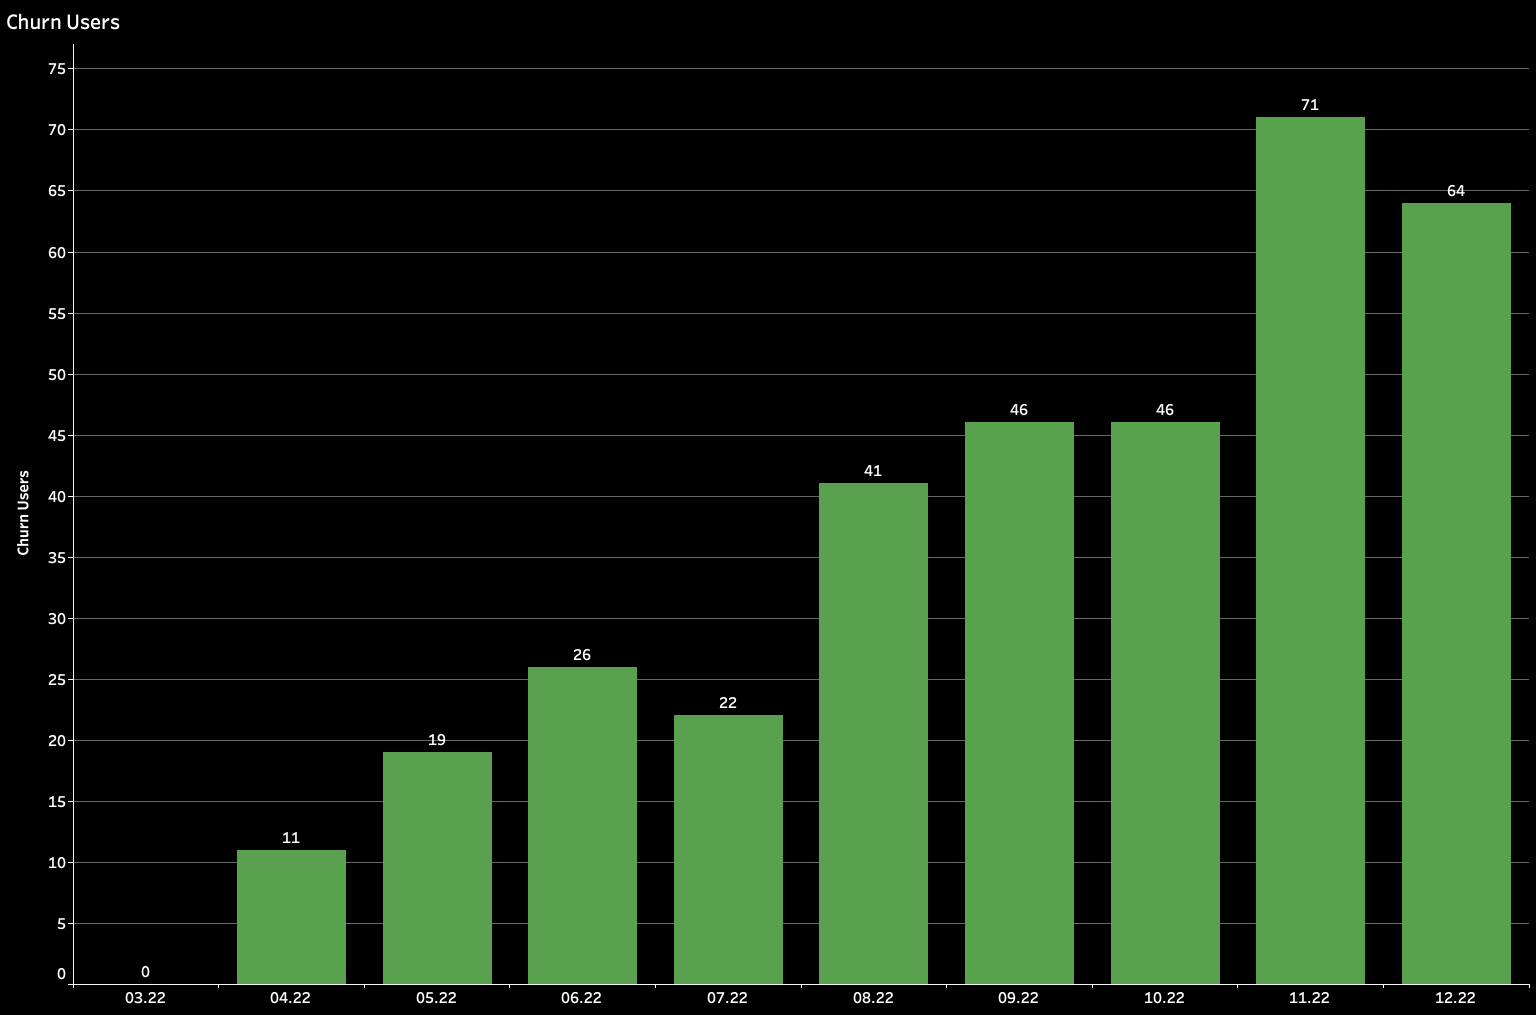
Script 6. Calculating Churned Users
//New Churned Users
SUM(
    IF [Status] = 'churn'
    THEN
        1
    ELSE
        0
    END
)
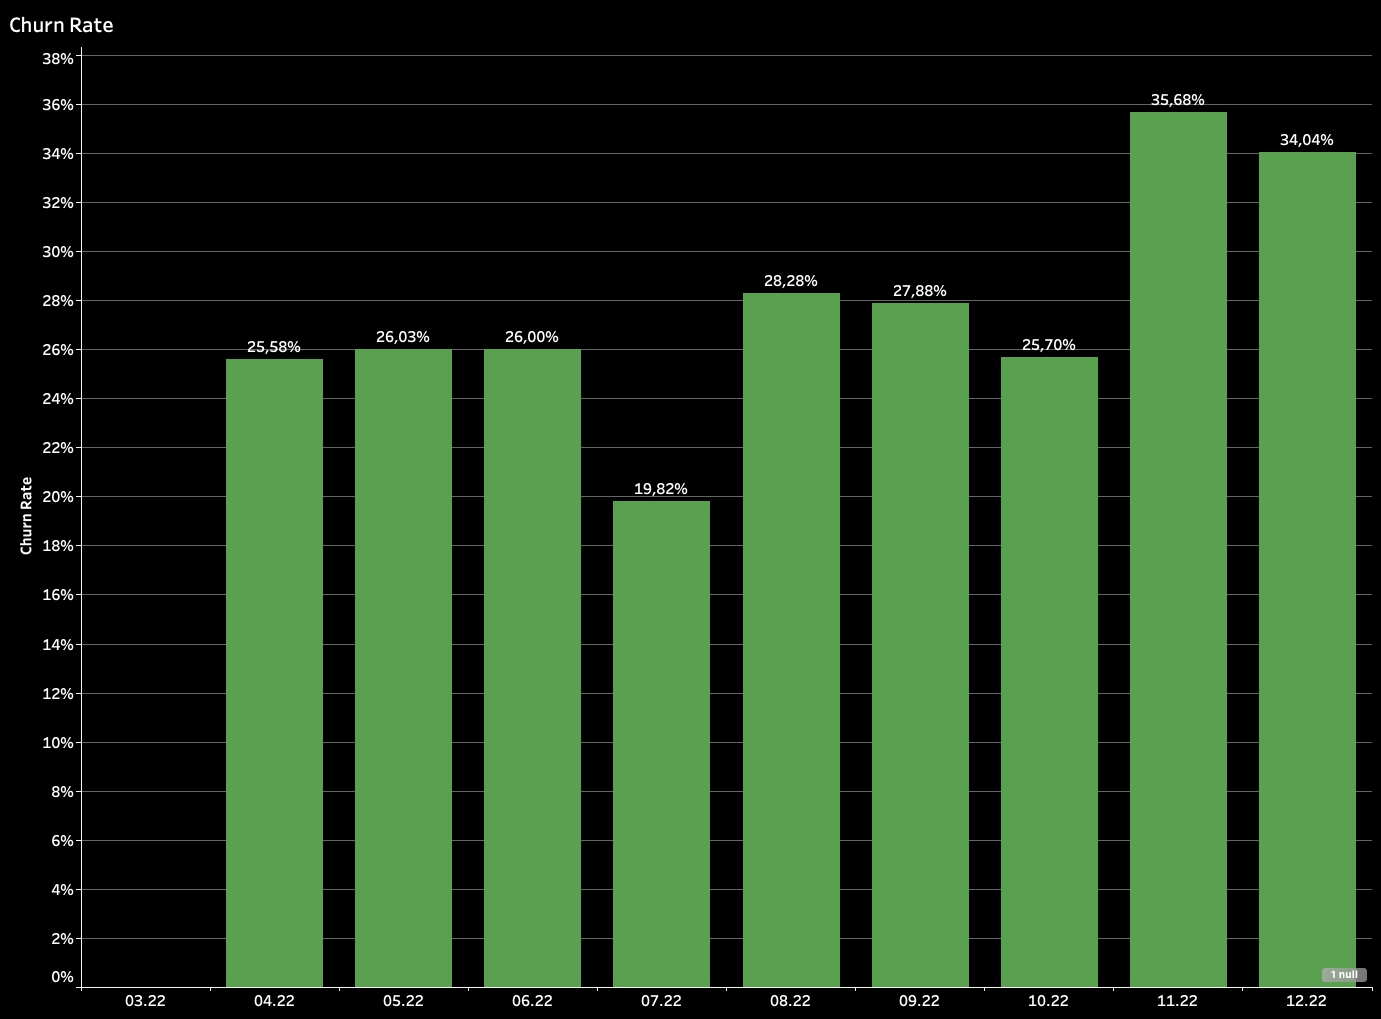
Script 7. Calculating Churned Rate
//New Churned Rated
[Churn Users] / LOOKUP(([Paid Users]), -1)
Script 8. Calculating Churned Revenue
//Churned Revenue
SUM(
    IF [Status] = 'churn'
    THEN
        [Total Revenue Previous]
    ELSE
        0
    END
)
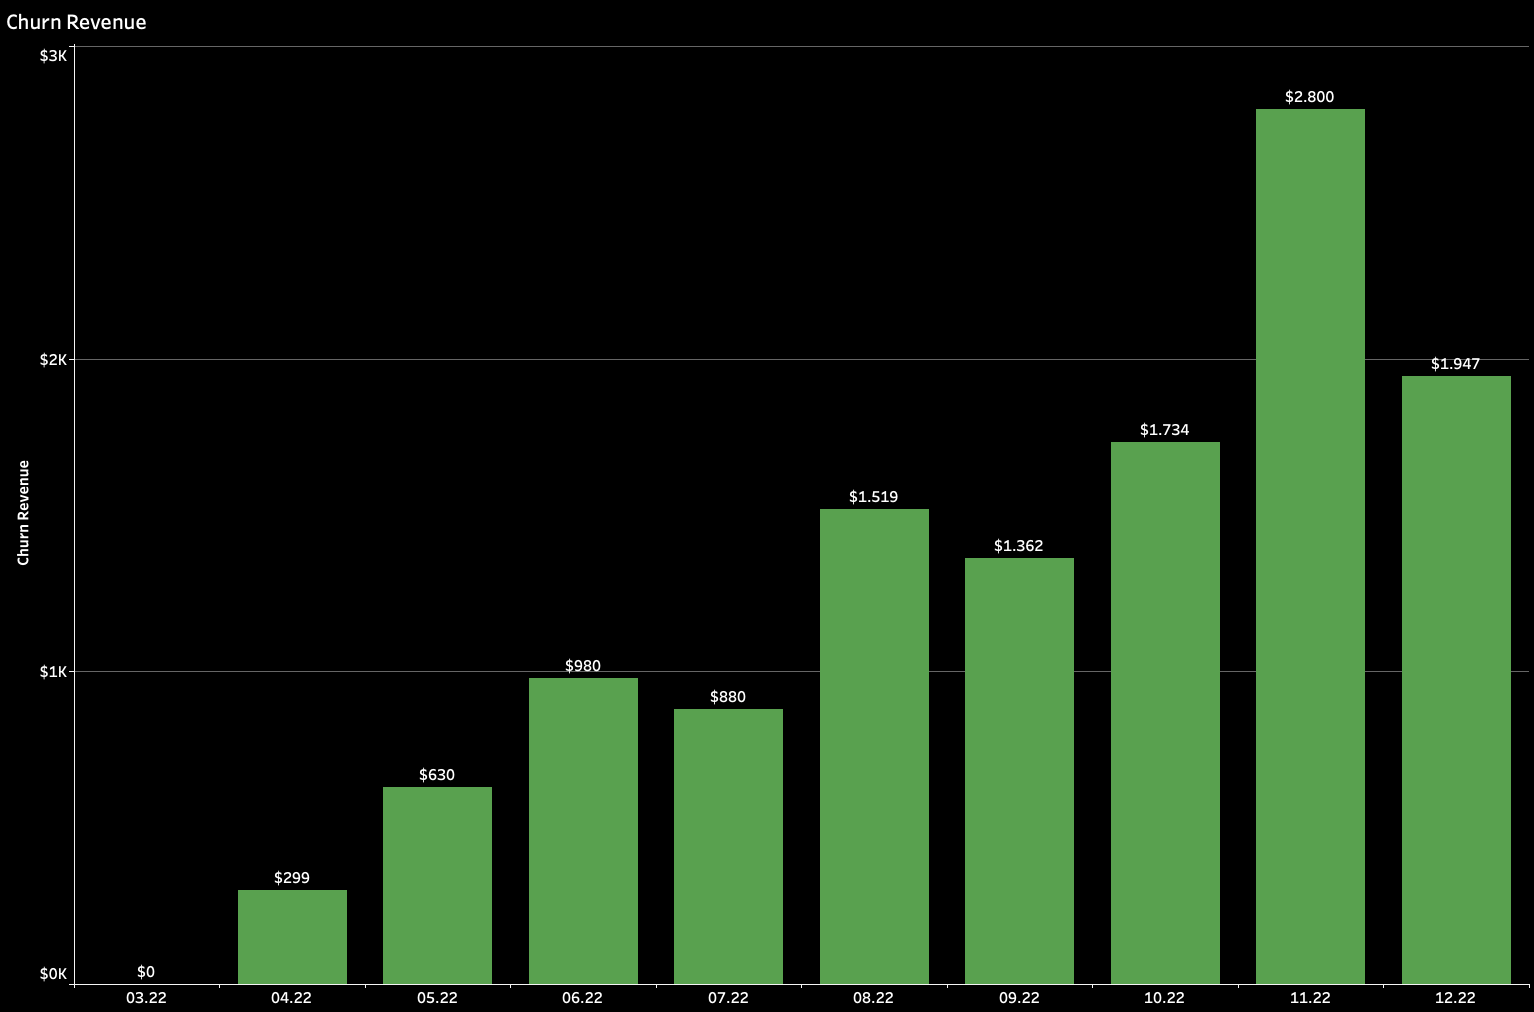
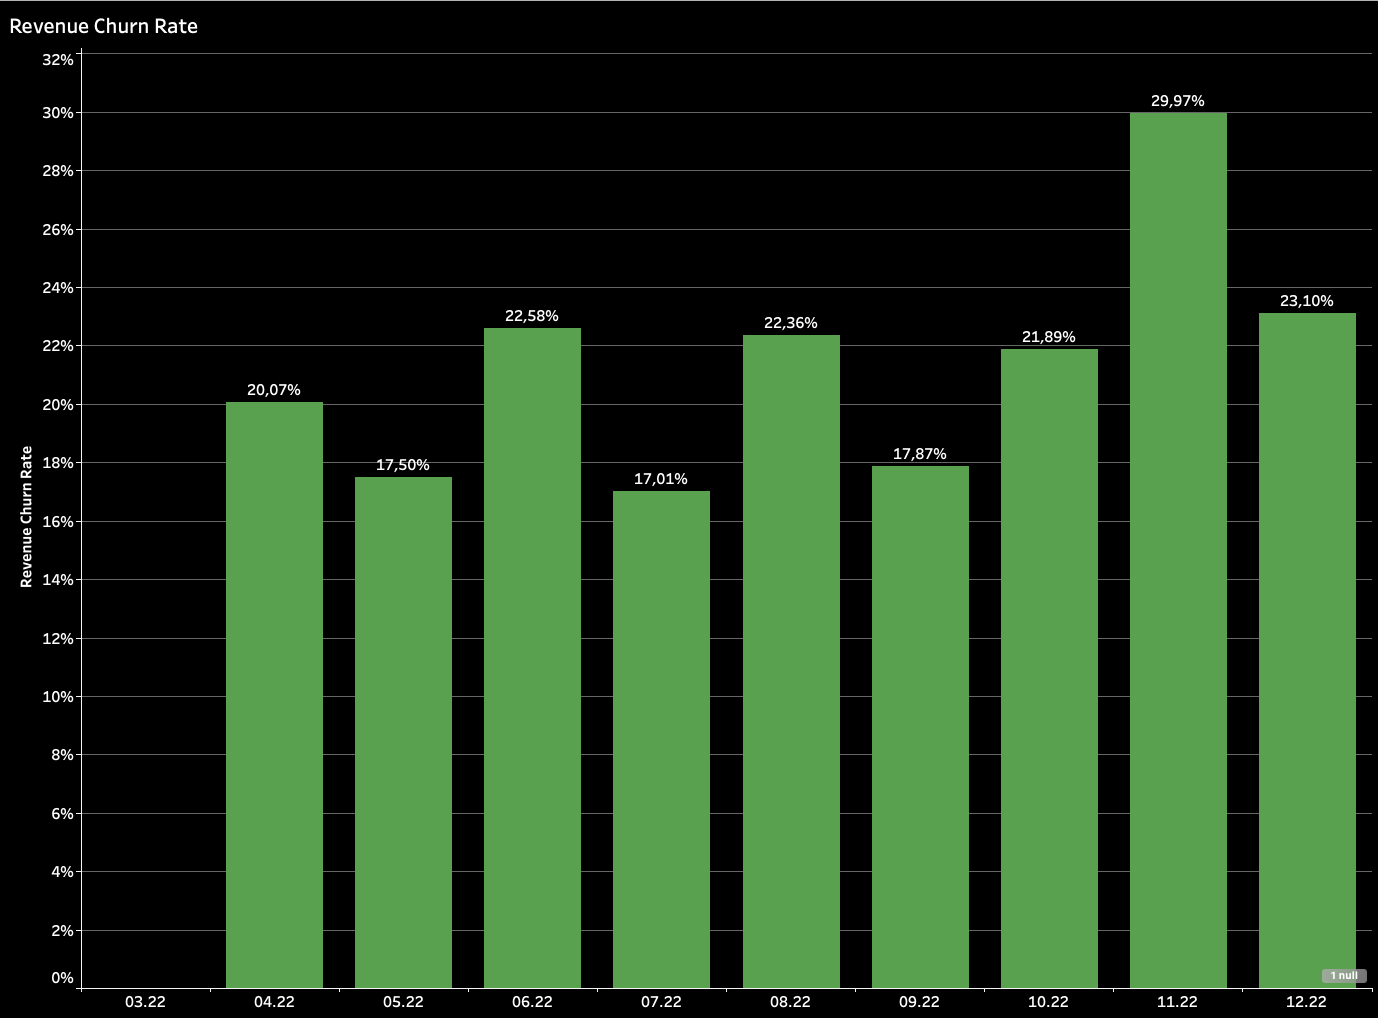
Script 9. Calculating Revenue Churned Rate
//Revenue Churned Rate
[Churn Revenue] / LOOKUP(([MRR]), -1)
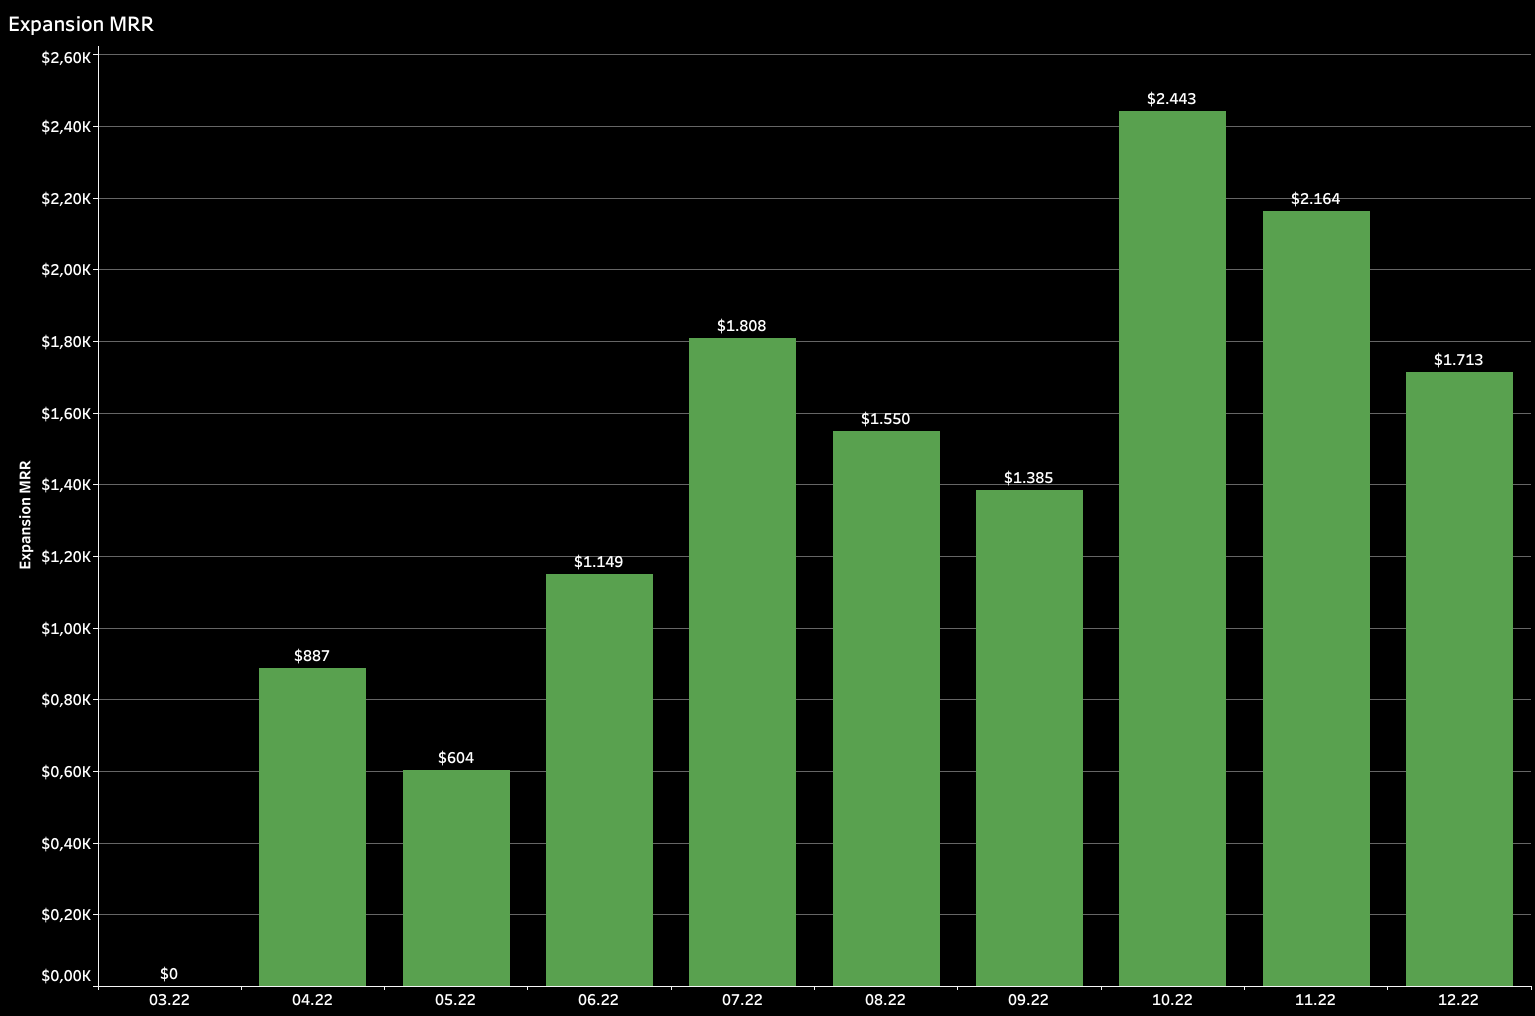
Script 10. Calculating Expansion MRR
//Expansion MRR
SUM(
    IF [Status] = 'active' AND [Total Revenue] > [Total Revenue Previous]
    THEN
        [Total Revenue] - [Total Revenue Previous]
    ELSE
        0
    END
)
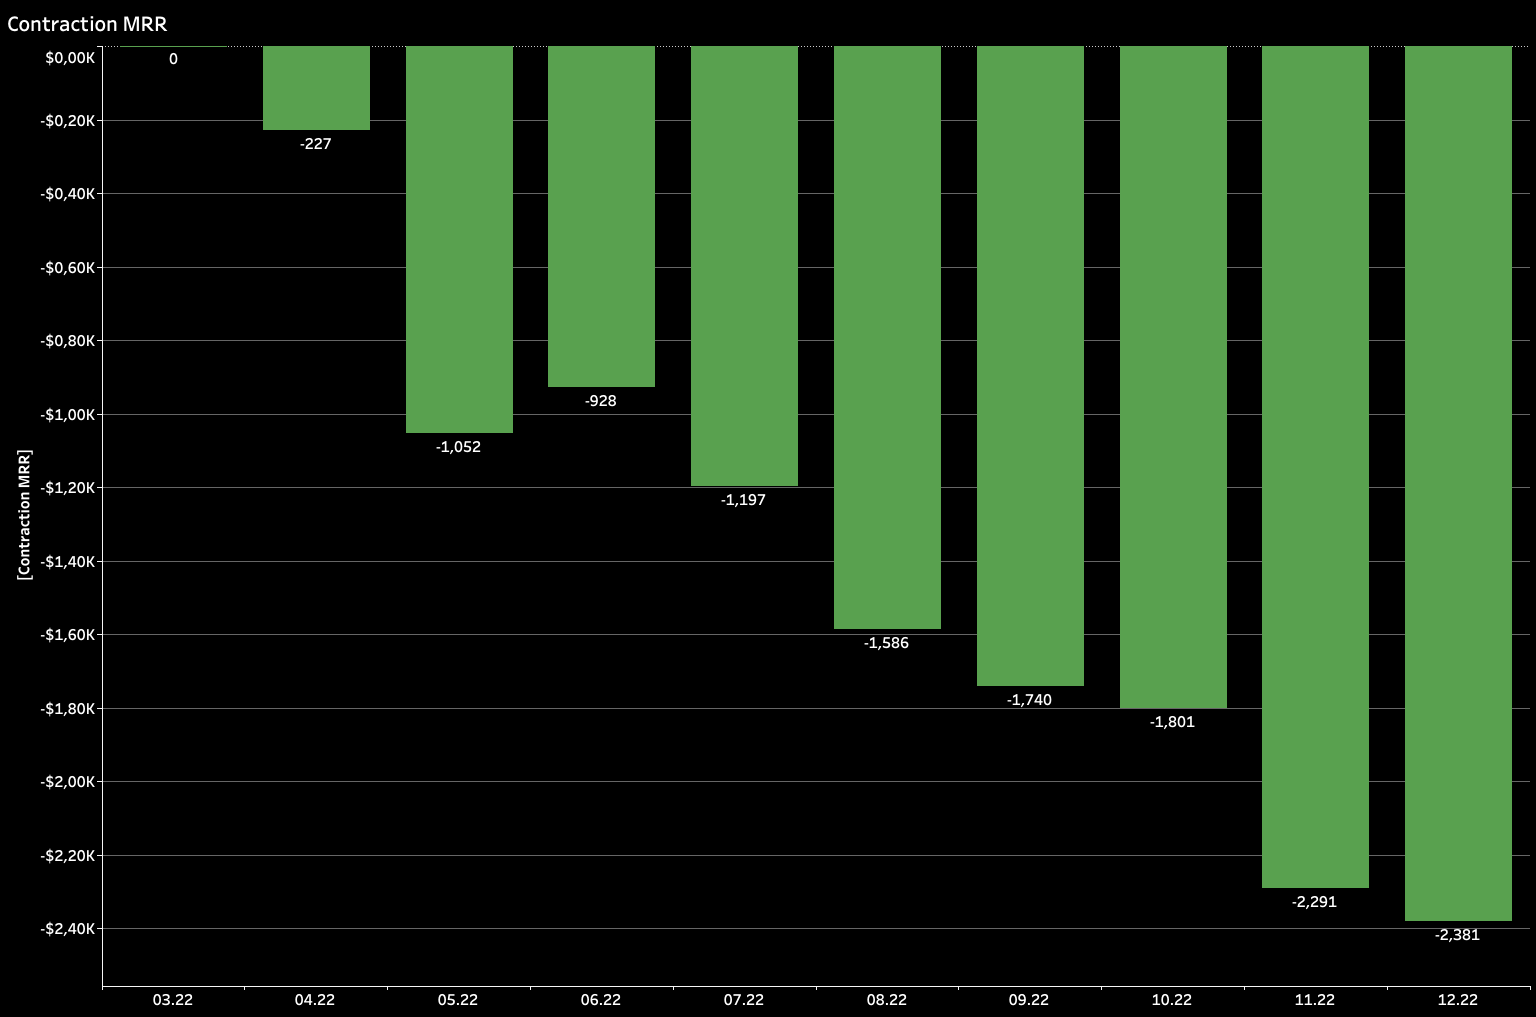
Script 11. Calculating Contraction MRR
//Contraction MRR
SUM(
    IF [Status] = 'active' AND [Total Revenue] < [Total Revenue Previous]
    THEN
        [Total Revenue Previous] - [Total Revenue]
    ELSE
        0
    END
)