Python Analysis
Commentary
In this section, calculations were performed based on the metrics specified above using the relevant databases, and the results obtained were interpreted and visualized. All the work was done in Jupyter Notebook, and the script file used for this section can be found here.
Scripts
Script 1. Import libraries
import pandas as pd
import matplotlib.pyplot as plt
import seaborn as sns
Script 2. Set dark theme for plots
plt.style.use("dark_background")
sns.set_palette("bright")
Script 3. Helper function to format plots
def format_plot(title, xlabel, ylabel):
    plt.title(title, color='white', fontsize=14)
    plt.xlabel(xlabel, color='white', fontsize=12)
    plt.ylabel(ylabel, color='white', fontsize=12)
    plt.legend(loc='best', fontsize=10)
    plt.grid(True, linestyle='--', alpha=0.5)
    plt.gca().tick_params(colors='white')
Script 4: Import games paid users data as users
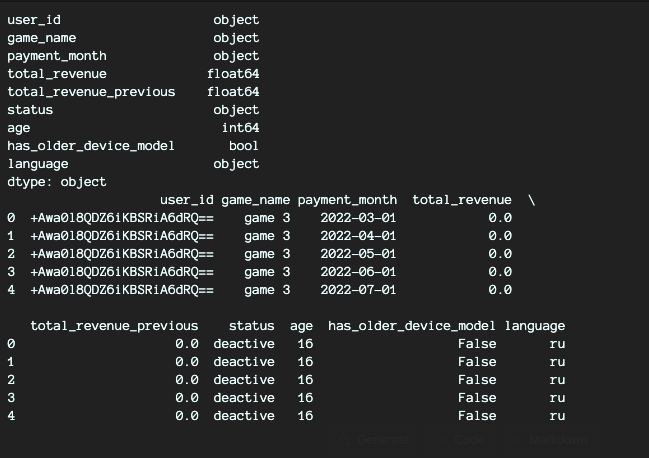
df = pd.read_csv('../data/final_games_dataset.csv')
print(df.dtypes)
print(df.head())
Script 5: Convert payment_date to datetime
df['payment_month'] = pd.to_datetime(df['payment_month'])
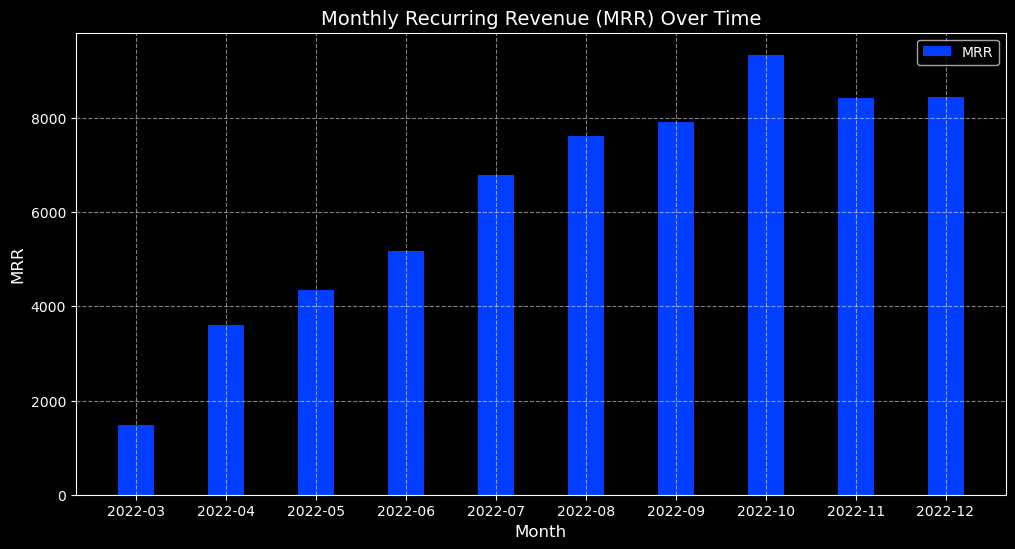
Script 6: Calculating Monthly Recurring Revenue
mrr = df[df['status'].isin(['active', 'back','new'])].groupby(df['payment_month'].dt.strftime('%Y-%m'))['total_revenue'].sum()
print("MRR:\n", mrr)
plt.figure(figsize=(12, 6))
plt.bar(mrr.index, mrr.values, label='MRR', width=.4)
format_plot('Monthly Recurring Revenue (MRR) Over Time', 'Month', 'MRR')
plt.show()
Script 7: Calculating Paid Users
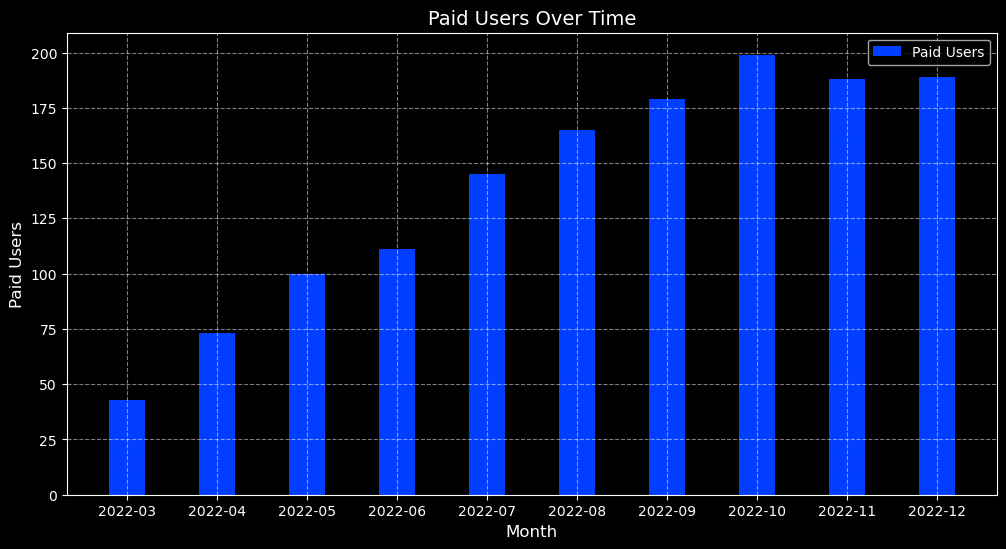
paid_users = df[df['total_revenue'] > 0].groupby(df['payment_month'].dt.strftime('%Y-%m'))['user_id'].nunique()
print("Paid Users:\n", paid_users)
plt.figure(figsize=(12, 6))
plt.bar(paid_users.index, paid_users.values, label='Paid Users', width=.4)
format_plot('Paid Users Over Time', 'Month', 'Paid Users')
plt.show()
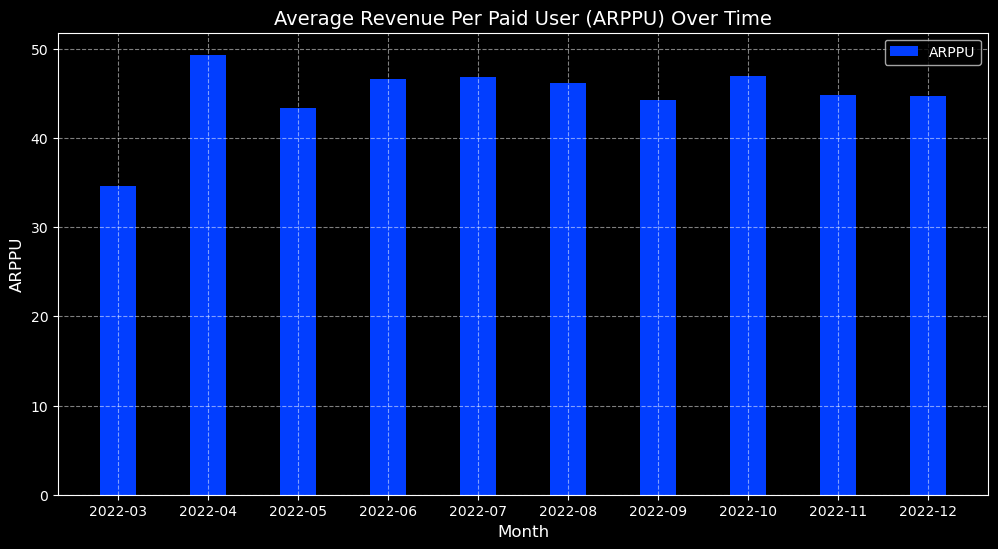
Script 8: Calculating Average Revenue Per Paid User (ARPPU)
Group payments by month and sum revenue to calculate MRR. The result is rounded to two decimals for consistency.
arppu = (mrr / paid_users).round(2)
print("ARPPU:\n", arppu)
plt.figure(figsize=(12, 6))
plt.bar(arppu.index, arppu.values, label='ARPPU', width=.4)
format_plot('Average Revenue Per Paid User (ARPPU) Over Time', 'Month', 'ARPPU')
plt.show()
Script 9: Calculating New Paid Users
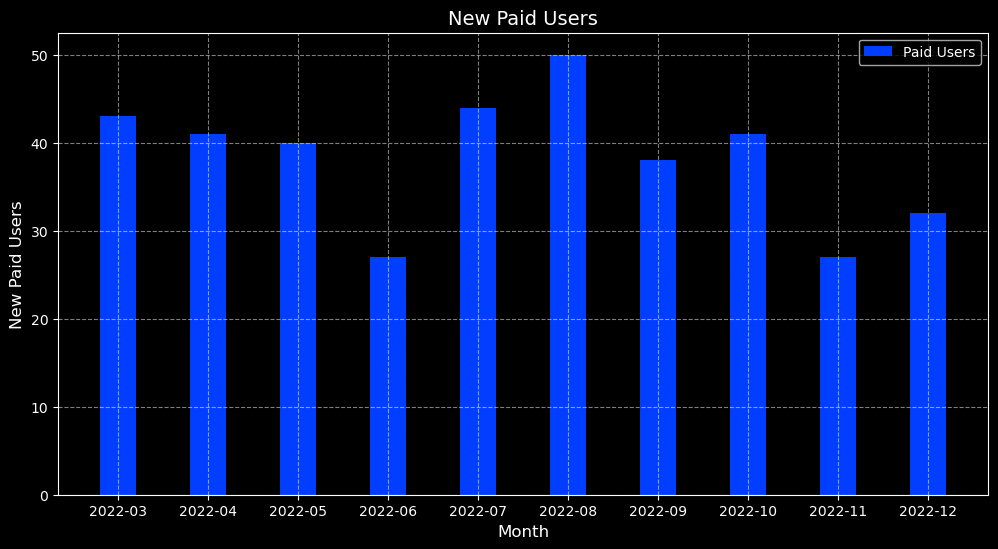
Find the first payment date per user, group by month, and count to get new paid users per month.
new_paid_users = df[(df['status'] == 'new') & (df['total_revenue'] > 0)].groupby(df['payment_month'].dt.strftime('%Y-%m'))['user_id'].nunique()
print("Paid Users:", new_paid_users)
plt.figure(figsize=(12, 6))
plt.bar(new_paid_users.index, new_paid_users.values, label='Paid Users', width=.4)
format_plot('New Paid Users', 'Month', 'New Paid Users')
plt.show()
Script 10: Calculating New MRR
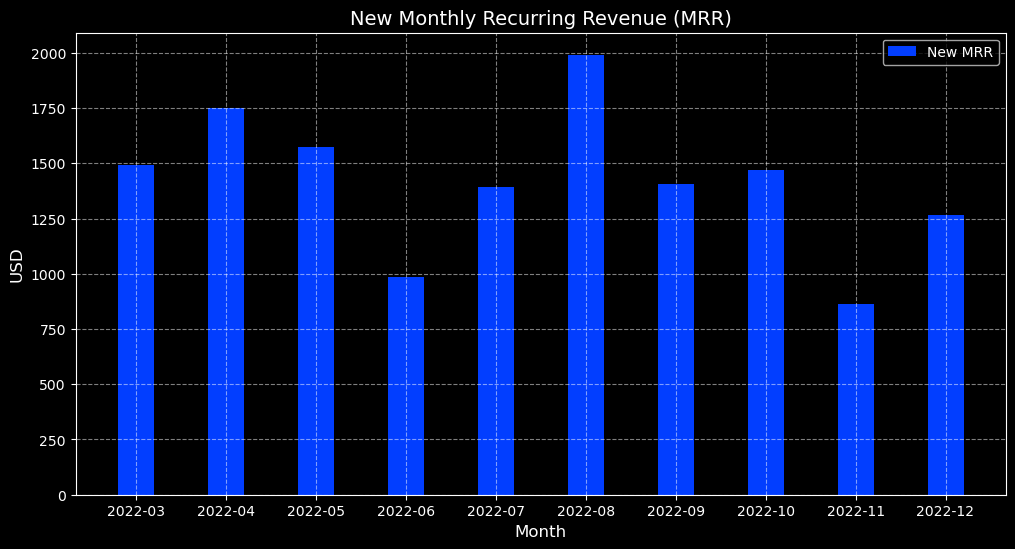
Find the first payment date per user, group by month, and sum to get new MRR per month.
new_mrr = df[(df['status'] == 'new') & (df['total_revenue'] > 0)].groupby(df['payment_month'].dt.strftime('%Y-%m'))['total_revenue'].sum().round(2)
print('New MRR:\n', new_mrr)
plt.figure(figsize=(12, 6))
plt.bar(new_mrr.index, new_mrr.values, label='New MRR', width=.4)
format_plot('New Monthly Recurring Revenue (MRR)', 'Month', 'USD')
plt.show()
Script 11: Calculating Churned Users
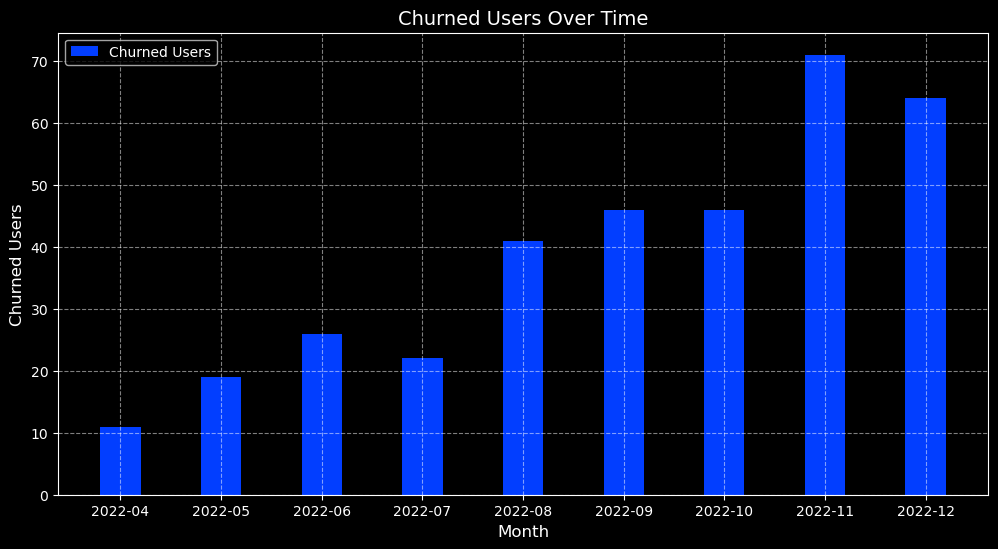
Find the last payment date per user, group by month, and count to get churned users per month.
churned_users = df[df['status'] == 'churn'].groupby(df['payment_month'].dt.strftime('%Y-%m'))['user_id'].nunique()
print("Churned Users:\n", churned_users)
plt.figure(figsize=(12, 6))
plt.bar(churned_users.index, churned_users.values, label='Churned Users', width=.4)
format_plot('Churned Users Over Time', 'Month', 'Churned Users')
plt.show()
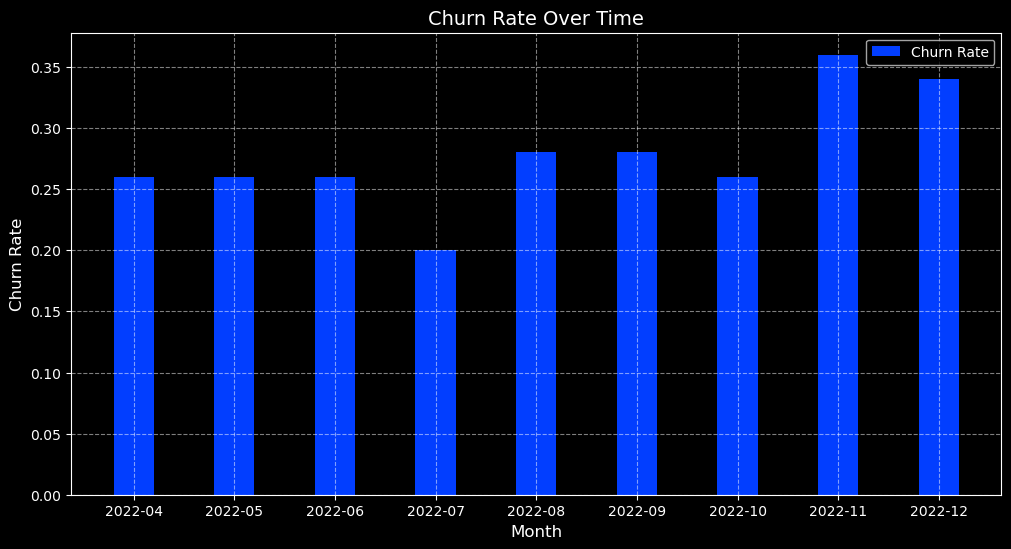
Script 12: Calculating Churned Rate
paid_users_shifted = paid_users.shift(1)
churn_rate = (churned_users / paid_users_shifted).round(2)
print("Churn Rate:\n", churn_rate)
plt.figure(figsize=(12, 6))
plt.bar(churn_rate.index, churn_rate.values, label='Churn Rate', width=.4)
format_plot('Churn Rate Over Time', 'Month', 'Churn Rate')
plt.show()
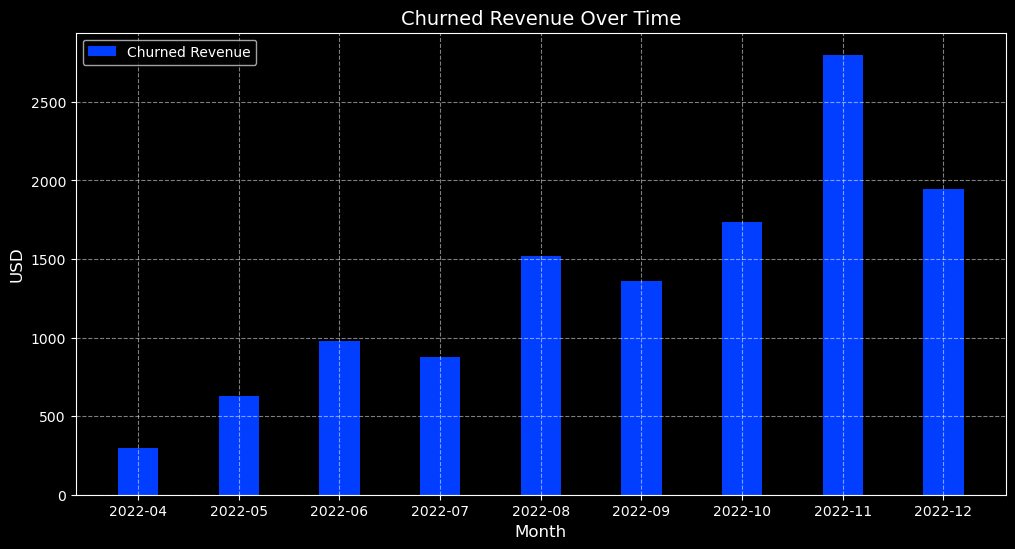
Script 13: Calculating Churned Revenue
churned_revenue = df[df['status'] == 'churn'].groupby(df['payment_month'].dt.strftime('%Y-%m'))['total_revenue_previous'].sum().round(2)
print("Churned Revenue:\n", churned_revenue)
plt.figure(figsize=(12, 6))
plt.bar(churned_revenue.index, churned_revenue.values, label='Churned Revenue', width=.4)
format_plot('Churned Revenue Over Time', 'Month', 'USD')
plt.show()
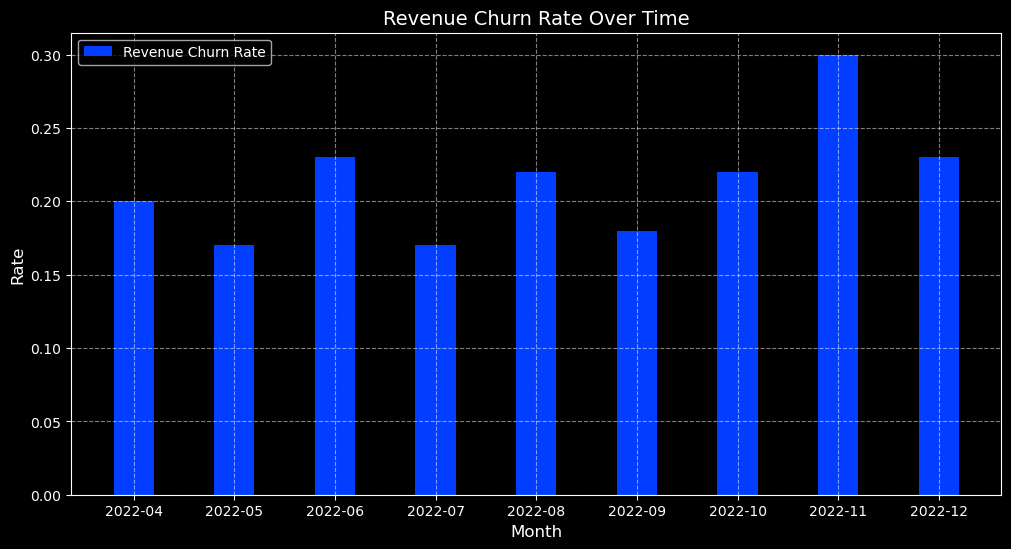
Script 14: Revenue Churned Rate
mrr_shifted = mrr.shift(1)
revenue_churn_rate = (churned_revenue / mrr_shifted).round(2)
print("Revenue Churn Rate:\n", revenue_churn_rate)
plt.figure(figsize=(12, 6))
plt.bar(revenue_churn_rate.index, revenue_churn_rate.values, label='Revenue Churn Rate', width=.4)
format_plot('Revenue Churn Rate Over Time', 'Month', 'Rate')
plt.show()
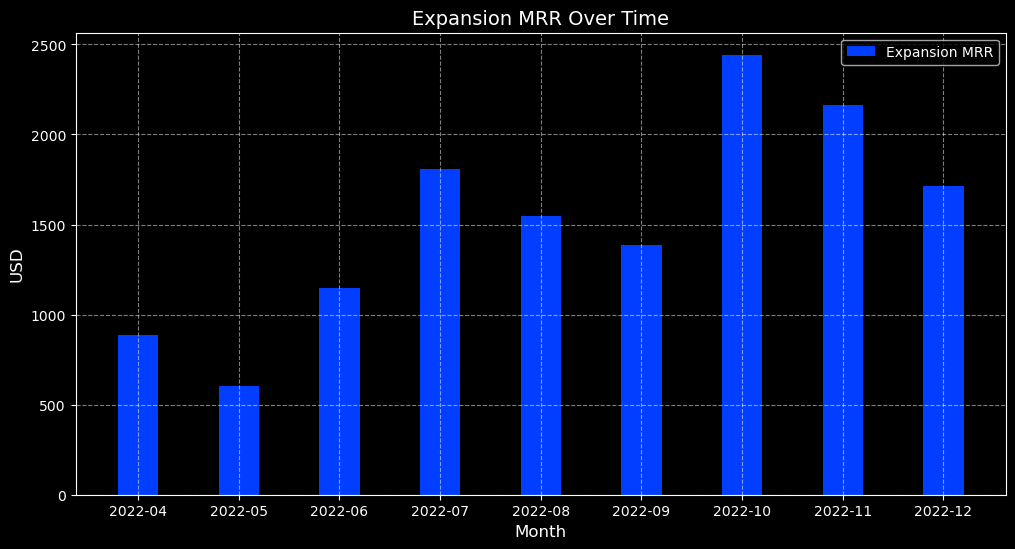
Script 15: Calculating Expension MRR
For churned users, sum their revenue from the previous month to calculate churned revenue.
expansion_mrr = df[(df['status'] == 'active') & (df['total_revenue'] > df['total_revenue_previous'])].groupby(df['payment_month'].dt.strftime('%Y-%m')).apply(lambda x: (x['total_revenue'] - x['total_revenue_previous']).sum()).round(2)
print("Expansion MRR:\n", expansion_mrr)
plt.figure(figsize=(12, 6))
plt.bar(expansion_mrr.index, expansion_mrr.values, label='Expansion MRR', width=.4)
format_plot('Expansion MRR Over Time', 'Month', 'USD')
plt.show()
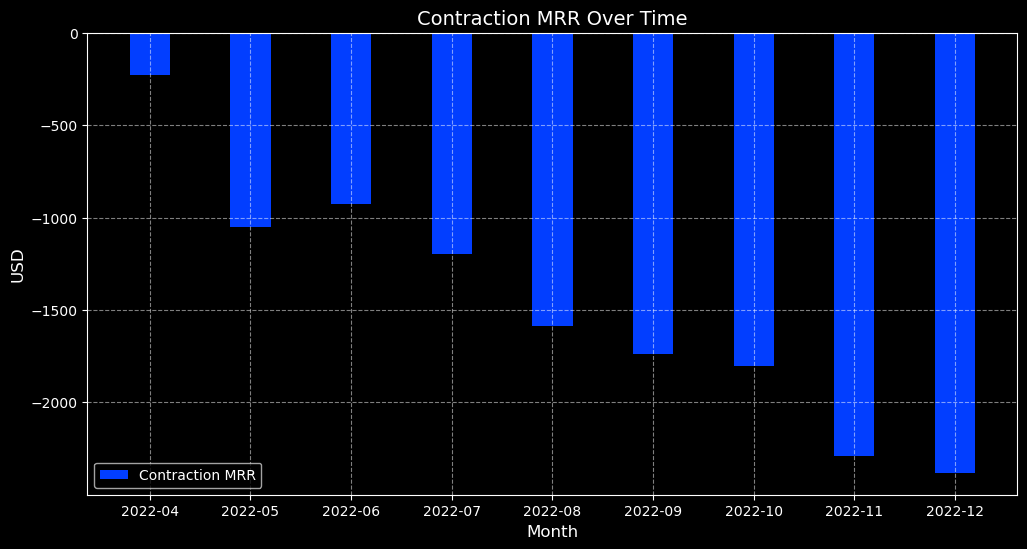
Script 16: Calculating Contraction MRR
contraction_mrr = df[(df['status'] == 'active') & (df['total_revenue'] < df['total_revenue_previous'])].groupby(df['payment_month'].dt.strftime('%Y-%m')).apply(lambda x: (x['total_revenue'] - x['total_revenue_previous']).sum()) print("Contraction MRR:\n", contraction_mrr) plt.figure(figsize=(12, 6)) plt.bar(contraction_mrr.index, contraction_mrr.values, label='Contraction MRR' , width=.4) format_plot('Contraction MRR Over Time', 'Month' , 'USD' ) plt.show()